
91.5% fewer data loss complaints through UX Research
91.5% fewer data loss complaints through UX Research
How I helped rebuild user trust and reduce critical complaints through a research approach centered on users’ real-world context.
How I helped rebuild user trust and reduce critical complaints through a research approach centered on users’ real-world context.
UX Research
UX Research
UX Design
UX Design
SaaS
SaaS
01
01
•
Overview
Overview
Have you ever been using a system, working for hours, and suddenly it feels like an important piece of information just disappeared? Trust in the software vanishes, along with the time you’ll spend trying to figure out what went wrong.
Usually, our first instinct is to blame the code, right? It must be a bug. But in this case, it was actually a UX issue that created the perception of data loss.
This was the reality of an app used by public healthcare professionals to register and monitor citizens’ health data, which was generating a high volume of support tickets related to supposed information loss.
Have you ever been using a system, working for hours, and suddenly it feels like an important piece of information just disappeared? Trust in the software vanishes, along with the time you’ll spend trying to figure out what went wrong.
Usually, our first instinct is to blame the code, right? It must be a bug. But in this case, it was actually a UX issue that created the perception of data loss.
This was the reality of an app used by public healthcare professionals to register and monitor citizens’ health data, which was generating a high volume of support tickets related to supposed information loss.
My role
I worked as the UX Designer and Researcher, leading the entire discovery process.
I worked as the UX Designer and Researcher, leading the entire discovery process.
I worked as the UX Designer and Researcher, leading the entire discovery process.
Research planning and method definition
Research planning and method definition
Conducting quantitative and qualitative research
Conducting quantitative and qualitative research
Data analysis and insight synthesis
Data analysis and insight synthesis
Co-creating solutions with the product team
Co-creating solutions with the product team
“Establishing continuous feedback and improvement processes
“Establishing continuous feedback and improvement processes
Tools | Methodologies | Frameworks
Figma, Google Forms, Google Sheets, Notion, Maze, Zoom, Whatsapp
Figma, Google Forms, Google Sheets, Notion, Maze, Zoom, Whatsapp
Figma, Google Forms, Google Sheets, Notion, Maze, Zoom, Whatsapp
Online survey, in-depth interviews, journey mapping, workshop facilitation, wireframing, and prototyping
Online survey, in-depth interviews, journey mapping, workshop facilitation, wireframing, and prototyping
Online survey, in-depth interviews, journey mapping, workshop facilitation, wireframing, and prototyping
SCRUM
SCRUM
SCRUM

Outcome
Support tickets related to data loss dropped from 20% of total support requests to 1.7% within one year — a 91.5% reduction.
We were dealing with a critical issue in a primary healthcare application that was compromising professionals’ work efficiency and generating a high volume of support tickets.
Through the implementation of UX Research, we identified interface and workflow issues that created the perception of data loss. After targeted improvements were implemented, the impact was clear: support requests dropped from 20% in April 2023 to 1.7% in April 2024.
Outcome
Support tickets related to data loss dropped from 20% of total support requests to 1.7% within one year — a 91.5% reduction.
We were dealing with a critical issue in a primary healthcare application that was compromising professionals’ work efficiency and generating a high volume of support tickets.
Through the implementation of UX Research, we identified interface and workflow issues that created the perception of data loss. After targeted improvements were implemented, the impact was clear: support requests dropped from 20% in April 2023 to 1.7% in April 2024.
Outcome
Support tickets related to data loss dropped from 20% of total support requests to 1.7% within one year — a 91.5% reduction.
We were dealing with a critical issue in a primary healthcare application that was compromising professionals’ work efficiency and generating a high volume of support tickets.
Through the implementation of UX Research, we identified interface and workflow issues that created the perception of data loss. After targeted improvements were implemented, the impact was clear: support requests dropped from 20% in April 2023 to 1.7% in April 2024.
Diagnosis
Although users reported data loss and ‘disappearing records’, a deeper investigation revealed that the issue was not caused by actual technical data loss, but rather by a UX failure.
More specifically, the root cause was the absence of Nielsen’s usability heuristic ‘Visibility of System Status.’ The platform did not clearly communicate to healthcare professionals that, due to LGPD (General Data Protection Law) restrictions, only one professional could be responsible for a citizen’s/patient’s data at a time.
When a different professional registered the same citizen using another login, the previous professional would lose access to the data, leading users to believe the information had been lost. This communication and visibility failure created a significant disconnect between the user experience and the system’s actual behavior, resulting in frustration, confusion, and a high volume of support tickets reporting ‘data loss’ and ‘disappearing records.’
Users no longer felt confident using the system, and many reported having experienced data loss before, leading them to duplicate their work in notebooks, spreadsheets, and documents as a safety measure, causing dissatisfaction, insecurity, and additional workload. This issue highlighted the absence of a crucial step in the software development process: UX Research.
Diagnosis
Although users reported data loss and ‘disappearing records’, a deeper investigation revealed that the issue was not caused by actual technical data loss, but rather by a UX failure.
More specifically, the root cause was the absence of Nielsen’s usability heuristic ‘Visibility of System Status.’ The platform did not clearly communicate to healthcare professionals that, due to LGPD (General Data Protection Law) restrictions, only one professional could be responsible for a citizen’s/patient’s data at a time.
When a different professional registered the same citizen using another login, the previous professional would lose access to the data, leading users to believe the information had been lost. This communication and visibility failure created a significant disconnect between the user experience and the system’s actual behavior, resulting in frustration, confusion, and a high volume of support tickets reporting ‘data loss’ and ‘disappearing records.’
Users no longer felt confident using the system, and many reported having experienced data loss before, leading them to duplicate their work in notebooks, spreadsheets, and documents as a safety measure, causing dissatisfaction, insecurity, and additional workload.
This issue highlighted the absence of a crucial step in the software development process: UX Research.
Diagnosis
Although users reported data loss and ‘disappearing records’, a deeper investigation revealed that the issue was not caused by actual technical data loss, but rather by a UX failure.
More specifically, the root cause was the absence of Nielsen’s usability heuristic ‘Visibility of System Status.’ The platform did not clearly communicate to healthcare professionals that, due to LGPD (General Data Protection Law) restrictions, only one professional could be responsible for a citizen’s/patient’s data at a time.
When a different professional registered the same citizen using another login, the previous professional would lose access to the data, leading users to believe the information had been lost. This communication and visibility failure created a significant disconnect between the user experience and the system’s actual behavior, resulting in frustration, confusion, and a high volume of support tickets reporting ‘data loss’ and ‘disappearing records.’
Users no longer felt confident using the system, and many reported having experienced data loss before, leading them to duplicate their work in notebooks, spreadsheets, and documents as a safety measure, causing dissatisfaction, insecurity, and additional workload. This issue highlighted the absence of a crucial step in the software development process: UX Research.

Visibility of System Status
Visibility of System Status
A usability principle that refers to a system’s ability to inform users about what is happening through clear and timely feedback.
A usability principle that refers to a system’s ability to inform users about what is happening through clear and timely feedback.
02
02
•
Design Process
Design Process
Business Analyst
Project Overview
Technical Limitations
Who are they?
Conduct research and define
Support Calls
Business Requirements
Devs
Users
Support Team
UX
Projects Office
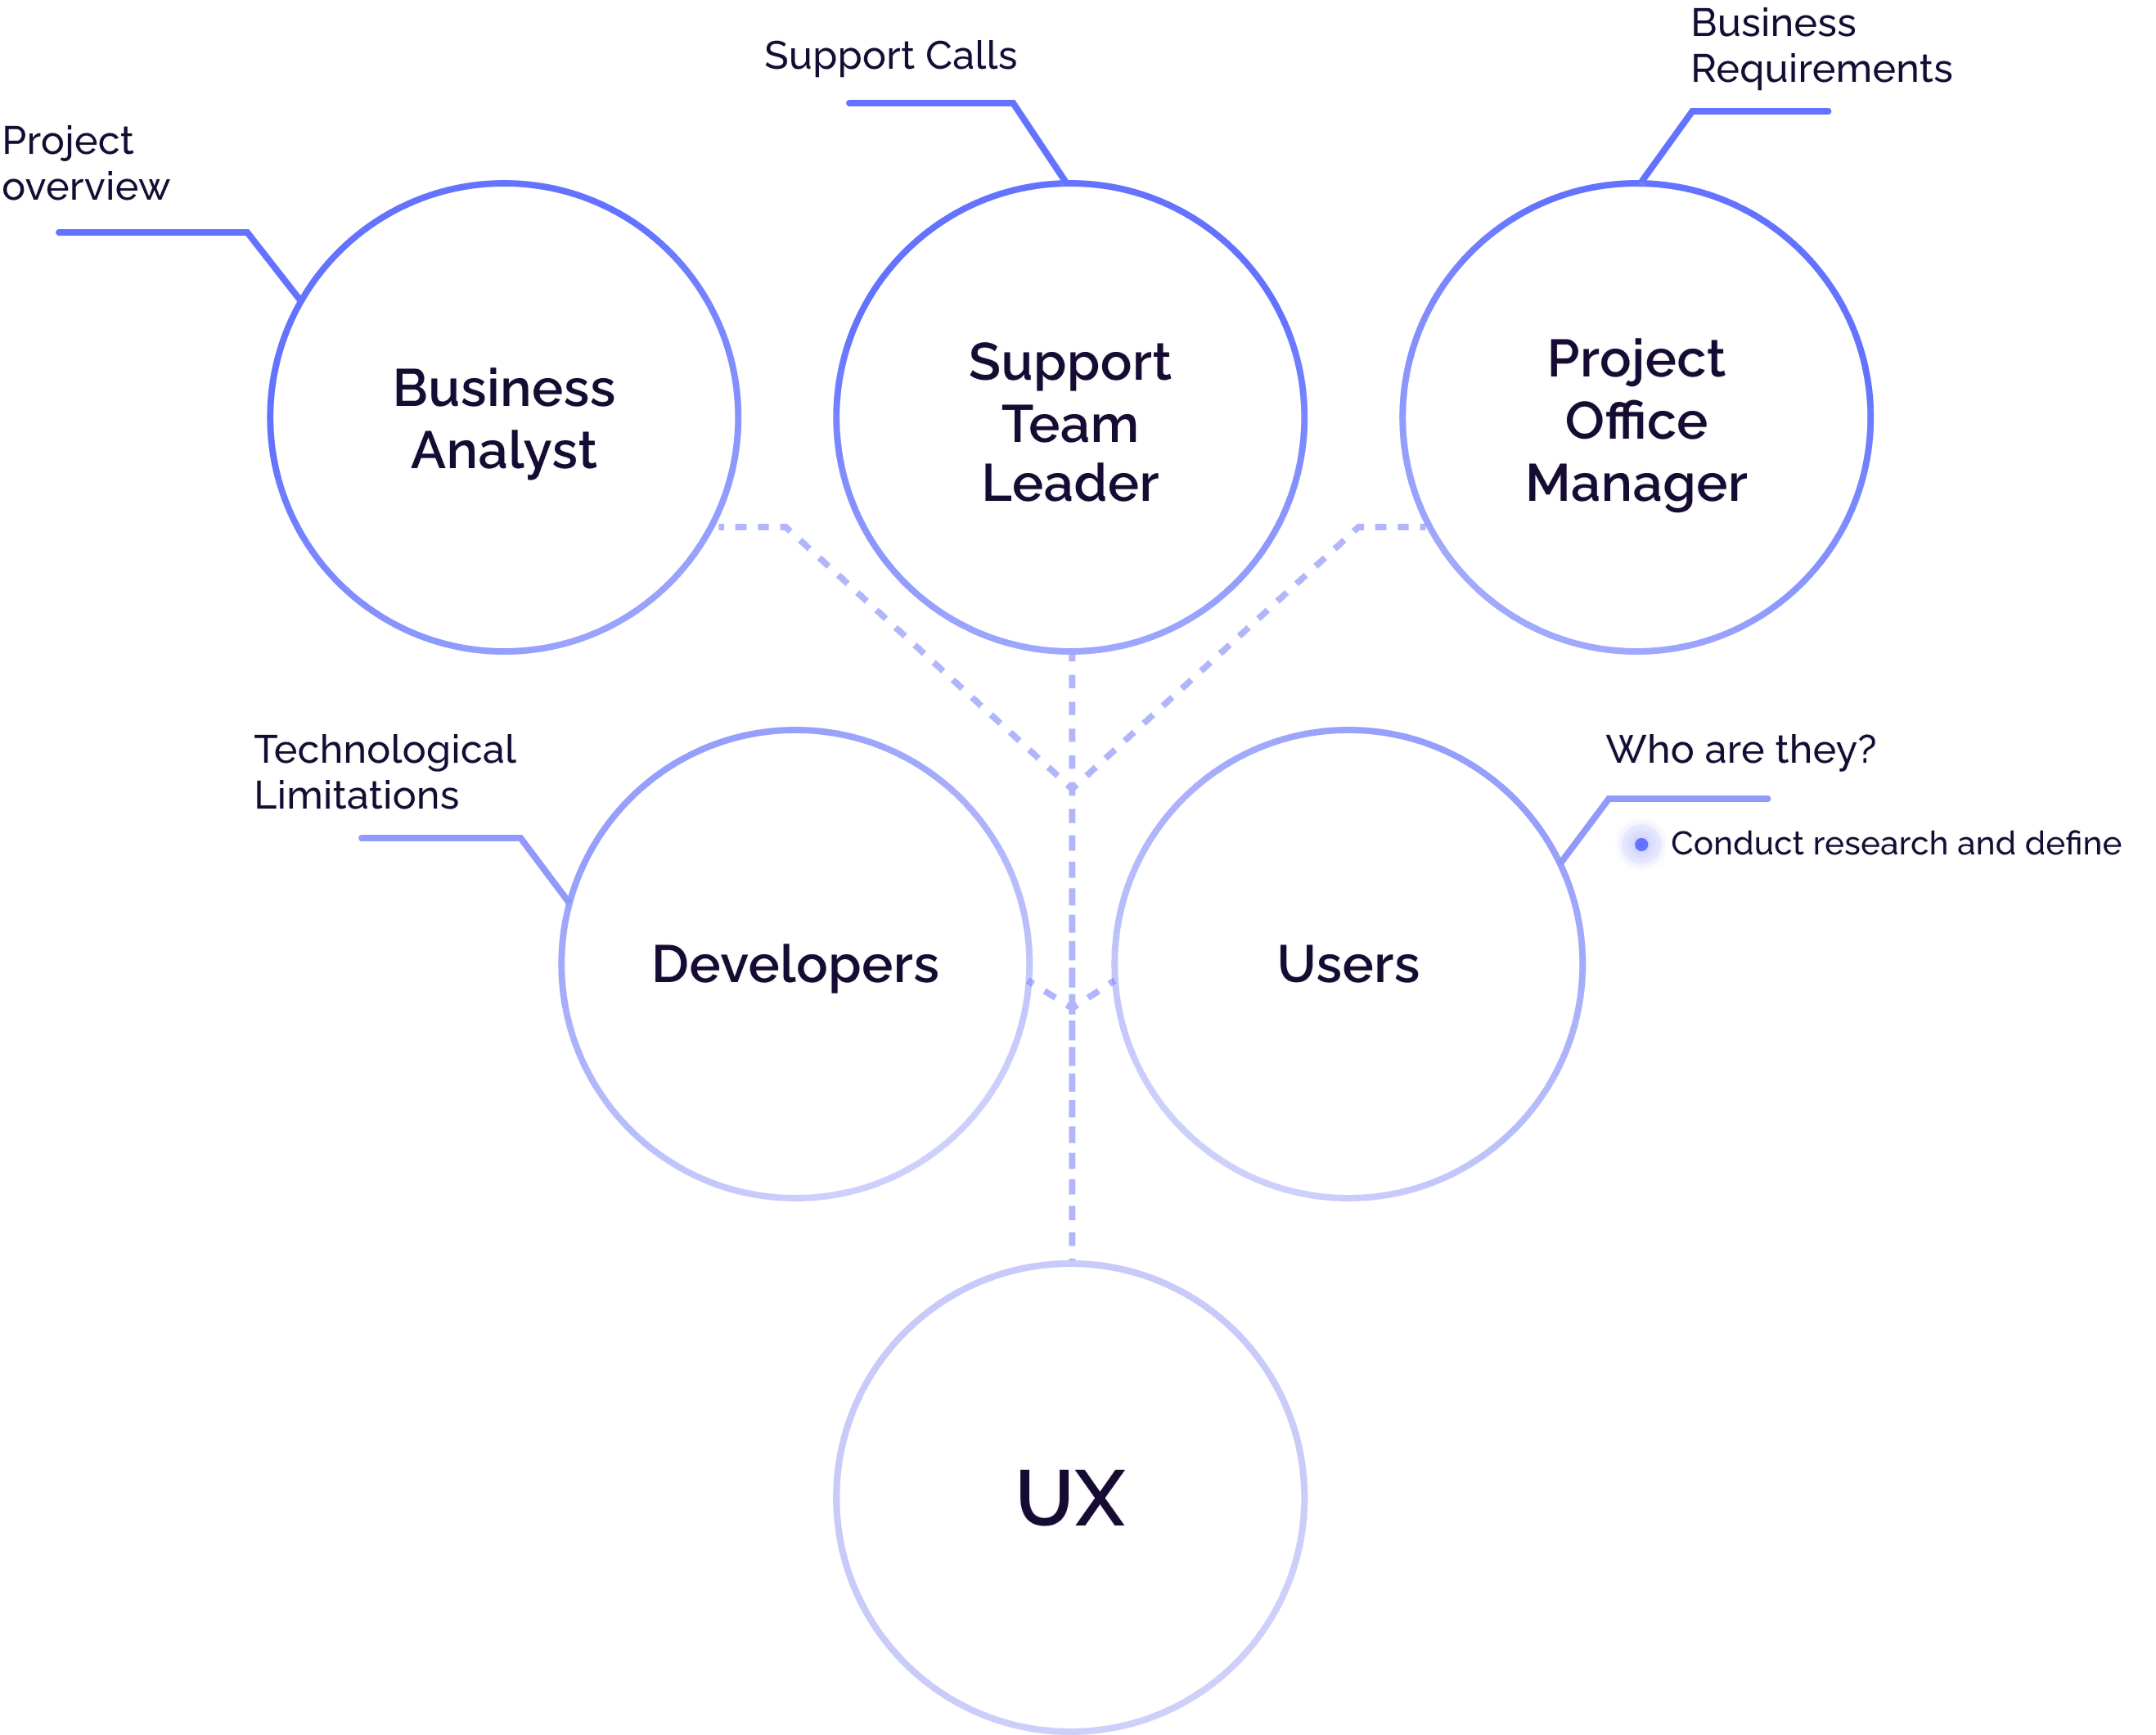
Stakeholder Mapping
Before defining the research stages, I conducted an assessment of the information already available within the company about the users and the app’s usage context. This step was essential for identifying knowledge gaps regarding the application’s real-world usage context and optimizing the research process.
The sources analyzed included:
Technical support tickets and informal user feedback.
Usage reports extracted from the system (when available).
Conversations with the support and quality assurance teams.
Reports from the product team.
I realized that although there were existing perceptions about issues such as data loss and system slowness, there was still a lack of structured and up-to-date information about the reality of the professionals using the app, the parallel tools they relied on, and their actual work journeys. This reinforced the need to conduct deeper field research, combining quantitative and qualitative data to build a more accurate and empathetic understanding of users.
Before defining the research stages, I conducted an assessment of the information already available within the company about the users and the app’s usage context. This step was essential for identifying knowledge gaps regarding the application’s real-world usage context and optimizing the research process.
The sources analyzed included:
Technical support tickets and informal user feedback.
Usage reports extracted from the system (when available).
Conversations with the support and quality assurance teams.
Reports from the product team.
I realized that although there were existing perceptions about issues such as data loss and system slowness, there was still a lack of structured and up-to-date information about the reality of the professionals using the app, the parallel tools they relied on, and their actual work journeys. This reinforced the need to conduct deeper field research, combining quantitative and qualitative data to build a more accurate and empathetic understanding of users.

Persona
To better understand who the app’s users were, I developed a structured questionnaire containing 20 open and closed-ended questions. The survey was conducted online using Google Forms. The questions covered:
The quantitative analysis was complemented by in-depth interviews, which helped validate behavioral patterns and contextual nuances. Combining these approaches resulted in realistic personas that reflected both the technical and emotional realities of healthcare professionals working in the field. These personas played a key role in guiding design decisions and prioritizing features that truly impacted users’ daily routines.
Work routines and responsibilities
Technology usage and internet access
Pain points, frustrations, and workaround strategies
Motivations, goals, and personal challenges
Accessibility needs (vision, hearing, etc.)
Persona
To better understand who the app’s users were, I developed a structured questionnaire containing 20 open and closed-ended questions. The survey was conducted online using Google Forms. The questions covered:
Work routines and responsibilities
Technology usage and internet access
Pain points, frustrations, and workaround strategies
Motivations, goals, and personal challenges
Accessibility needs (vision, hearing, etc.)
The quantitative analysis was complemented by in-depth interviews, which helped validate behavioral patterns and contextual nuances. Combining these approaches resulted in realistic personas that reflected both the technical and emotional realities of healthcare professionals working in the field.
These personas played a key role in guiding design decisions and prioritizing features that truly impacted users’ daily routines.
Persona
To better understand who the app’s users were, I developed a structured questionnaire containing 20 open and closed-ended questions. The survey was conducted online using Google Forms. The questions covered:
The quantitative analysis was complemented by in-depth interviews, which helped validate behavioral patterns and contextual nuances. Combining these approaches resulted in realistic personas that reflected both the technical and emotional realities of healthcare professionals working in the field. These personas played a key role in guiding design decisions and prioritizing features that truly impacted users’ daily routines.
Work routines and responsibilities
Technology usage and internet access
Pain points, frustrations, and workaround strategies
Motivations, goals, and personal challenges
Accessibility needs (vision, hearing, etc.)
After defining the persona, I conducted a detailed analysis of recurring support tickets, system requirements derived from public procurement documents, and the results gathered from research with primary users. This process revealed critical insights, among which the lack of trust and confidence in the system emerged as the most urgent issue identified.
After defining the persona, I conducted a detailed analysis of recurring support tickets, system requirements derived from public procurement documents, and the results gathered from research with primary users. This process revealed critical insights, among which the lack of trust and confidence in the system emerged as the most urgent issue identified.
After defining the persona, I conducted a detailed analysis of recurring support tickets, system requirements derived from public procurement documents, and the results gathered from research with primary users. This process revealed critical insights, among which the lack of trust and confidence in the system emerged as the most urgent issue identified.
Brainstorm
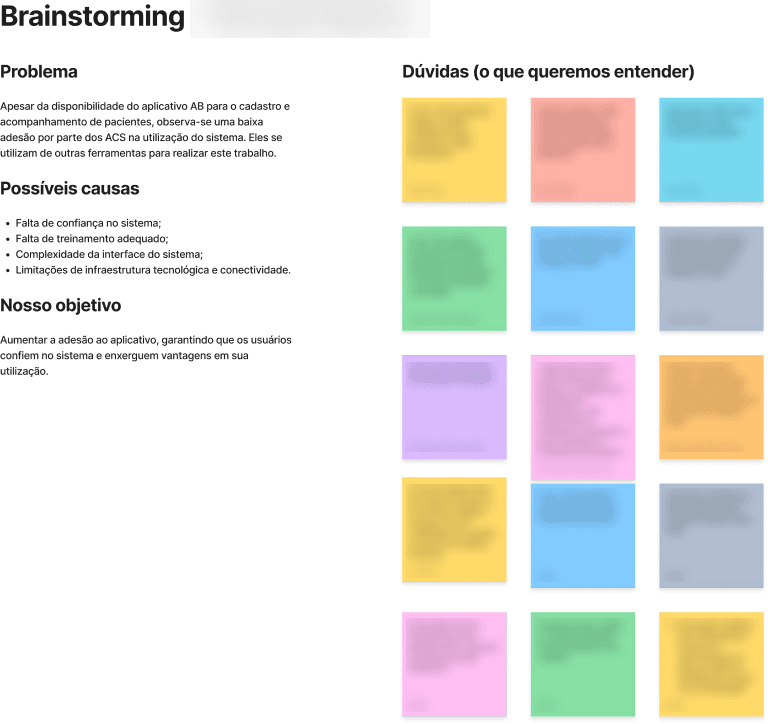
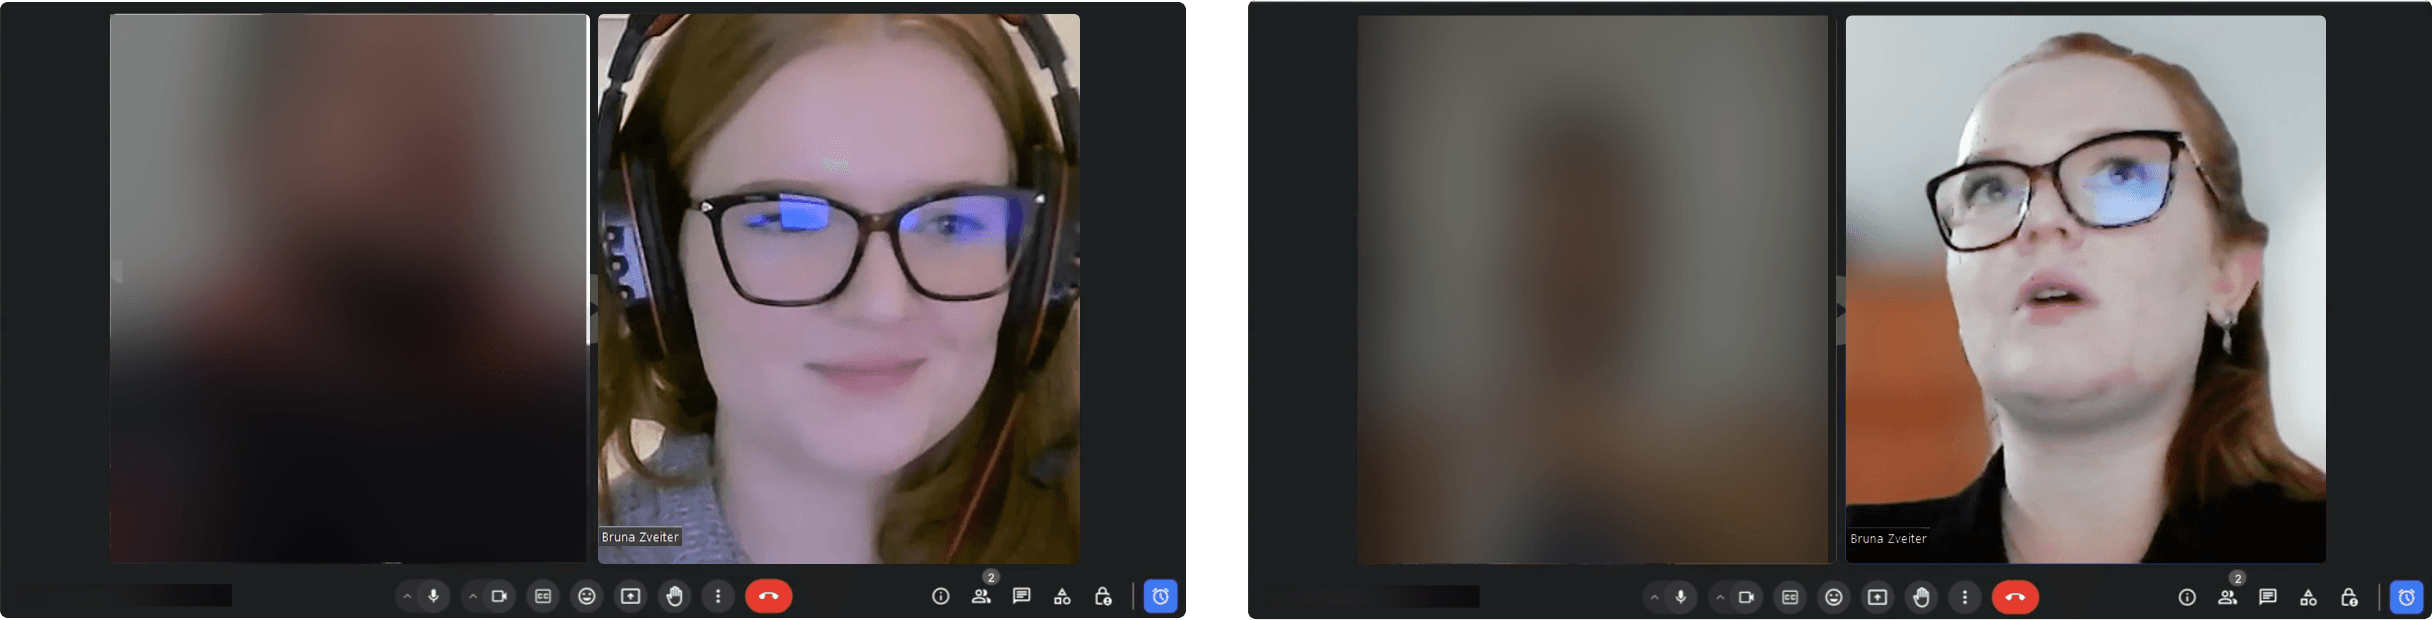
I facilitated a brainstorming session to align the team’s expectations and discuss the findings from the first stage of research. All team members had the opportunity to express the questions and uncertainties they hoped to clarify with the help of users. Based on the analysis of data gathered in the previous stages and the questions raised during the brainstorming session, I developed a semi-structured interview script to conduct interviews with selected users. The goal was to deepen the understanding of the critical issues identified and clarify any remaining uncertainties.
Brainstorm
I facilitated a brainstorming session to align the team’s expectations and discuss the findings from the first stage of research. All team members had the opportunity to express the questions and uncertainties they hoped to clarify with the help of users. Based on the analysis of data gathered in the previous stages and the questions raised during the brainstorming session, I developed a semi-structured interview script to conduct interviews with selected users. The goal was to deepen the understanding of the critical issues identified and clarify any remaining uncertainties.
Brainstorm
I facilitated a brainstorming session to align the team’s expectations and discuss the findings from the first stage of research. All team members had the opportunity to express the questions and uncertainties they hoped to clarify with the help of users. Based on the analysis of data gathered in the previous stages and the questions raised during the brainstorming session, I developed a semi-structured interview script to conduct interviews with selected users. The goal was to deepen the understanding of the critical issues identified and clarify any remaining uncertainties.
03
03
•
Prioritization
Prioritization
Throughout the research process, I identified several issues that were categorized, together with other stakeholders, into three priority levels:
Throughout the research process, I identified several issues that were categorized, together with other stakeholders, into three priority levels:
Urgent: issues that required immediate attention
Important: issues to be addressed after the urgent ones
Improvement opportunities: issues to be further explored and implemented in the future
In this case study, we focused on the highest-priority issue: complaints related to data loss.
04
04
•
Proposed Solution
Proposed Solution
Enhancement of the visual synchronization indicator, clearly displaying the data-saving status.
Smart notifications alerting agents when records have been deactivated, deleted, or re-registered by other professionals, including identification of who performed the action.
Action history and synchronization logs to increase transparency and user control.

05
05
•
Results
Results
After the proposed improvements were delivered, we monitored their impact through two main channels: technical support tickets and a structured user satisfaction survey.
After the proposed improvements were delivered, we monitored their impact through two main channels: technical support tickets and a structured user satisfaction survey.
📉 Reduction In Support Tickets
📉 Reduction In Support Tickets
Houve uma queda de 91,5% nas reclamações relacionadas à “perda de dados” em abril de 2024 em relação a abril de 2023, evidenciando que a principal dor dos usuários foi diretamente resolvida.
A transparência trazida pelo novo módulo de visualização de fichas desativadas diminuiu a frustração e o retrabalho, reduzindo também o tempo gasto pelas equipes de suporte com explicações e reorientações.
Houve uma queda de 91,5% nas reclamações relacionadas à “perda de dados” em abril de 2024 em relação a abril de 2023, evidenciando que a principal dor dos usuários foi diretamente resolvida.
A transparência trazida pelo novo módulo de visualização de fichas desativadas diminuiu a frustração e o retrabalho, reduzindo também o tempo gasto pelas equipes de suporte com explicações e reorientações.
📈 Feature Evaluation
📈 Feature Evaluation
The feature created to allow users to view patient records deactivated due to re-registration received an average satisfaction score of 3.54 out of 4 points.
Most users perceived direct value in the improvement, gaining a clearer understanding of what was happening to their records and regaining control over the information.
This feedback confirms that the user-centered approach, guided by evidence and active listening, resolved not only a symptom (support complaints), but also the root cause of the problem: the lack of visibility and communication regarding actions performed by other professionals within the system.
The feature created to allow users to view patient records deactivated due to re-registration received an average satisfaction score of 3.54 out of 4 points.
Most users perceived direct value in the improvement, gaining a clearer understanding of what was happening to their records and regaining control over the information.
This feedback confirms that the user-centered approach, guided by evidence and active listening, resolved not only a symptom (support complaints), but also the root cause of the problem: the lack of visibility and communication regarding actions performed by other professionals within the system.
05
•
Impacts & Learnings
The research-driven solutions generated meaningful impact across the product, its users, and the organization as a whole:
Reduction in support tickets.
Increased trust in the application, with users feeling more confident completing their records without relying on external tools.
Improved workflow efficiency and user productivity.
Reduced workload for the support team, allowing them to focus on more strategic issues.
The research-driven solutions generated meaningful impact across the product, its users, and the organization as a whole:
• Reduction in support tickets.
Increased trust in the application, with users feeling more confident completing their records without relying on external tools.
Improved workflow efficiency and user productivity.
Reduced workload for the support team, allowing them to focus on more strategic issues.
The research-driven solutions generated meaningful impact across the product, its users, and the organization as a whole:
• Reduction in support tickets.
Increased trust in the application, with users feeling more confident completing their records without relying on external tools.
Improved workflow efficiency and user productivity.
Reduced workload for the support team, allowing them to focus on more strategic issues.
This project reinforced important lessons for my work as a UX Designer:
Complex problems can sometimes be solved with simple solutions, if we know the right questions to ask. Providing visual feedback about re-registrations proved to be more effective than any major technical refactor.
Empathy for users’ real-world context transforms products. Understanding the actual working conditions of healthcare professionals, in the field, offline, and under pressure, was essential for building empathy within the team.
Cross-functional collaboration is key. Involving support, business, QA, and development teams from the beginning made the implementation process more aligned and efficient.
More than solving a system issue, this project demonstrated how user-centered design can transform the perception of a product and improve the quality of care delivered to the population.
This project reinforced important lessons for my work as a UX Designer:
Complex problems can sometimes be solved with simple solutions, if we know the right questions to ask. Providing visual feedback about re-registrations proved to be more effective than any major technical refactor.
Empathy for users’ real-world context transforms products. Understanding the actual working conditions of healthcare professionals, in the field, offline, and under pressure, was essential for building empathy within the team.
Cross-functional collaboration is key. Involving support, business, QA, and development teams from the beginning made the implementation process more aligned and efficient.
More than solving a system issue, this project demonstrated how user-centered design can transform the perception of a product and improve the quality of care delivered to the population.

•
•
Thank you for your attention!
Thank you for your attention!
Vamos conversar sobre o seu projeto!
This case study has been anonymized. The flows, screens, and data presented have been adapted and recreated exclusively for educational purposes.
This case study has been anonymized. The flows, screens, and data presented have been adapted and recreated exclusively for educational purposes.
All rights reserved © 2026 Bruna Zveiter
All rights reserved © 2026 Bruna Zveiter
All rights reserved © 2026 Bruna Zveiter
Summary